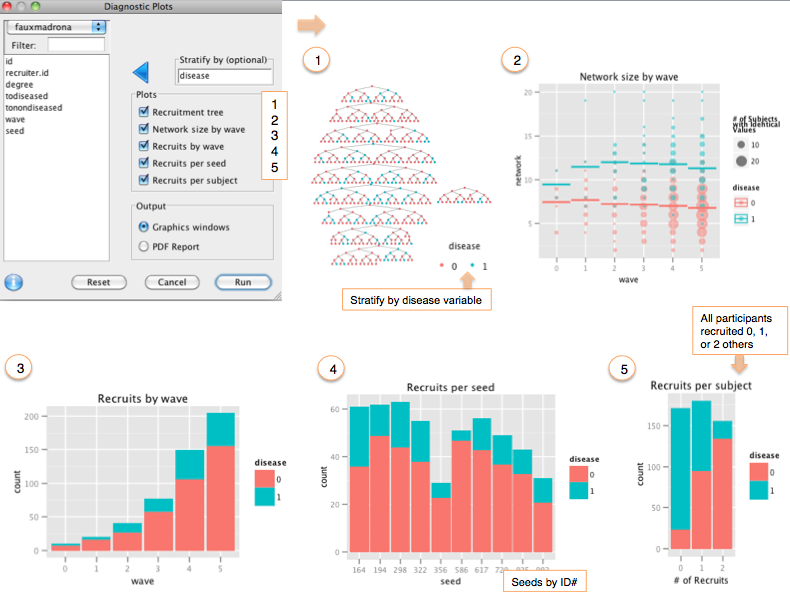
The Recruitment Diagnostics dialog under the Plots menu creates up to five charts, providing a snapshot of the recruitment process. While the first chart, the recruitment tree (see also RDSAnalystPlotRecruitmentTree) maps the sample network, the other charts summarize an aspect of the tree.
